Every used vehicle a franchise dealer acquires came from somewhere. Auction, appraisal lane walk-in, proactive database outreach, off-street purchase. Each channel has a different cost to acquire, a different average gross, and a different net margin per unit.
Most dealers have a rough sense of these differences. Few have a framework that makes the comparison explicit — one they can apply to their own operation, bring to a management meeting, or use to make a deliberate budget allocation decision.
This post builds that framework.
Why Channel Matters More Than Volume
The instinct in used vehicle operations is to think in terms of volume — how many units did we acquire, how many did we retail. But volume without channel discipline produces inconsistent margin. A dealer retailing 40 units a month primarily through auction is running a very different profitability model than a dealer retailing 40 units with half sourced from their own database — even if the gross-per-unit number in the DMS looks similar.
The difference shows up in three places:
Cost to acquire. Auction fees, transport, and recon risk are baked into every auction unit before it retails. Database-sourced trade-ins have no acquisition cost beyond the outreach system itself. That spread — which as detailed in The True Cost of Buying Used Cars at Auction runs $1,800–$2,500 above the buy price — directly reduces net margin per unit.
Average gross. The transaction dynamic of a proactively sourced trade-in from a past buyer produces structurally higher gross than an auction unit. The reasons — no competing appraisal, known vehicle history, dealer-controlled timing — are covered in detail in The Trade-In Gross Advantage. The spread is approximately $3,500 per unit.
Compounding effect. A database trade-in generates two gross opportunities — used acquisition and the replacement vehicle sale. An auction unit generates one. At scale, that compounding effect is the difference between a used department that supports the overall P&L and one that operates on thin margin and gets squeezed every time market conditions shift.
The Three-Channel ROI Framework
Here’s the framework, built around the three primary acquisition channels available to a franchise dealer. The numbers below use conservative industry averages — your actual figures will vary by market, franchise, and database size, but the relative economics hold consistently.
Channel 1: Auction
| Metric | Amount |
|---|---|
| Average buy price | $14,000 |
| Buyer’s fee | $450 |
| Transport | $350 |
| Recon (average) | $1,100 |
| Floor plan carry (45 days) | $175 |
| True all-in cost | $16,075 |
| Average retail price | $17,500 |
| Deal jacket gross | $3,500 |
| True net gross (after acquisition cost) | ~$1,425 |
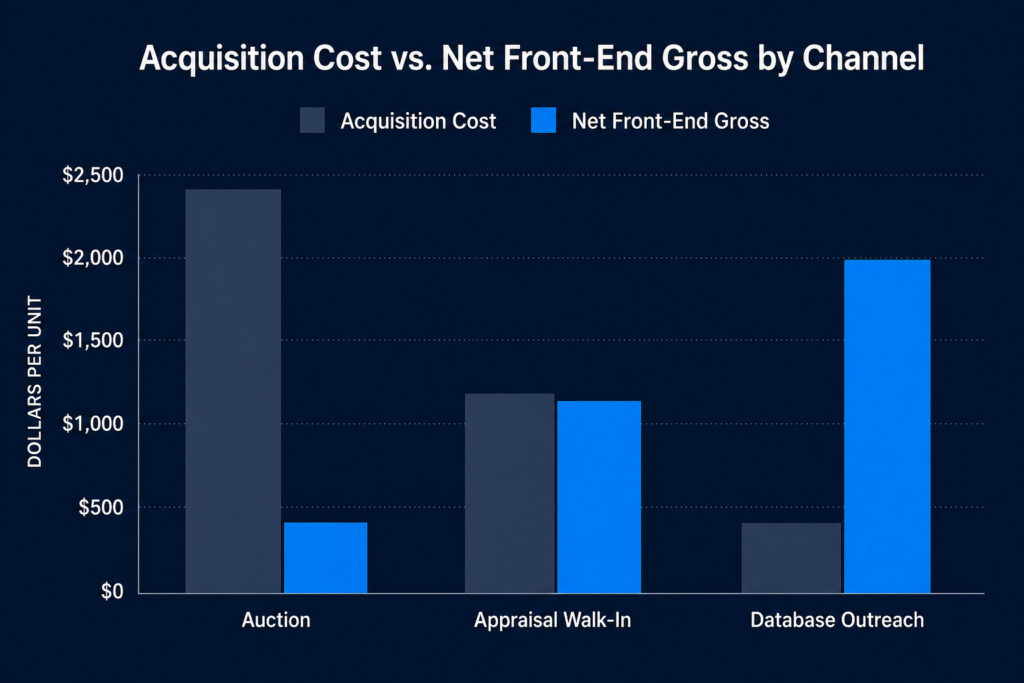
Cost per unit acquired (above buy price): ~$2,075 Average front-end gross: ~$1,425 net Secondary sale opportunity: None
Channel 2: Appraisal Lane Walk-In
| Metric | Amount |
|---|---|
| Acquisition cost above trade allowance | Minimal — no fees, no transport |
| Recon (known vehicle, lower risk) | $700–$1,000 avg |
| Floor plan carry (faster retail cycle) | $100–$150 avg |
| True all-in cost above trade allowance | ~$850–$1,150 |
| Average front-end gross | ~$2,500–$3,000 |
Secondary sale opportunity: Possible, not guaranteed
Cost per unit acquired: Low Average front-end gross: Mid Secondary sale opportunity: Situational — depends on whether the customer is actively buying
Channel 3: Proactive Database Outreach — Past Buyer
| Metric | Amount |
|---|---|
| Acquisition cost | Cost of outreach system — not per-unit |
| Recon (known vehicle, predictable) | $600–$900 avg |
| Floor plan carry (motivated buyer = faster retail) | $75–$125 avg |
| True all-in cost above trade allowance | ~$675–$1,025 |
| Average front-end gross | ~$5,000 |
Secondary sale opportunity: High — customer is actively upgrading.
Cost per unit acquired: Lowest Average front-end gross: Highest Secondary sale opportunity: Consistent — proactive outreach targets upgrade-ready customers
Applying the Framework to Your Operation
The framework above gives you the relative economics. Applying it to your specific operation requires three inputs:
1. Your current channel mix. What percentage of your monthly used acquisitions come from each channel? If you don’t track this explicitly, a 90-day lookback through your deal jackets will give you a reasonable picture. Most dealers who run this exercise find they’re more auction-dependent than they realized.
2. Your database size and estimated upgrade-eligible segment. How many past buyers are in your CRM? As covered in The Trade-In Gross Advantage, industry data suggests 15–30% of a typical dealer database is upgrade-eligible at any given time. That’s your addressable outreach universe.
3. Your current monthly used gross. Take your total used front-end gross for the last 90 days, divide by units retailed, and compare against the channel averages above. If your per-unit gross is tracking closer to the auction average than the database average, your channel mix is costing you margin.
What a Channel Shift Actually Produces
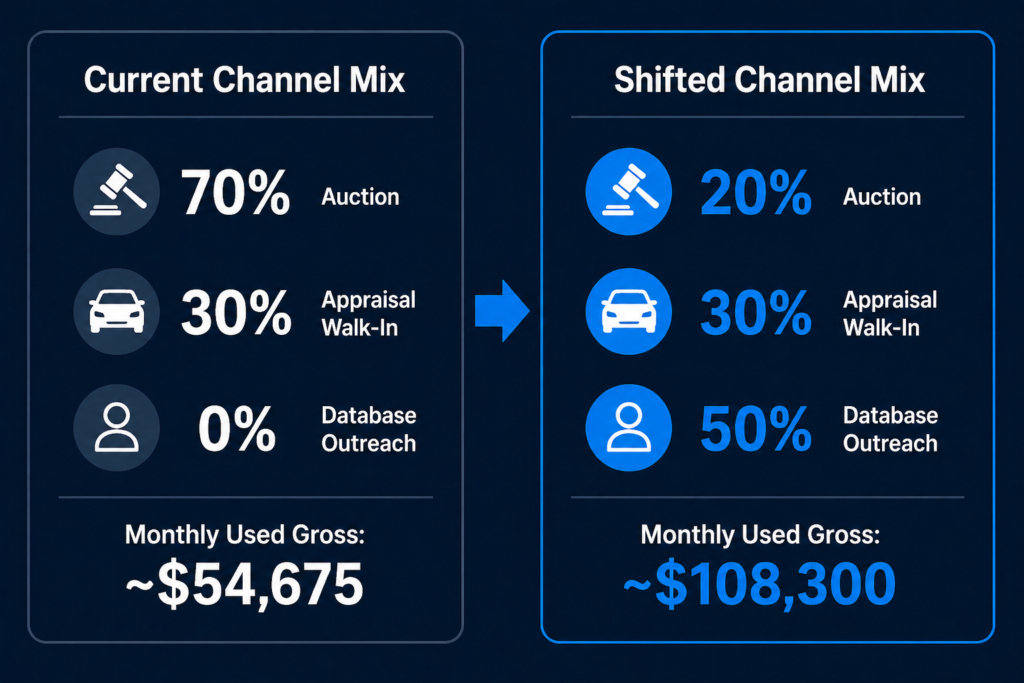
Let’s run the math on a mid-size single-rooftop dealer retailing 30 used units a month, currently sourcing 70% from auction and 30% from appraisal lane walk-ins, with no systematic database outreach.
Current state:
- 21 auction units × $1,425 net gross = $29,925
- 9 appraisal walk-ins × $2,750 net gross = $24,750
- Total monthly used front-end gross: ~$54,675
After shifting 15 units/month to database outreach:
- 6 auction units × $1,425 = $8,550
- 9 appraisal walk-ins × $2,750 = $24,750
- 15 database trade-ins × $5,000 = $75,000
- Total monthly used front-end gross: ~$108,300
That’s a $53,625 monthly gross increase from the same 30-unit retail volume — purely from changing where the inventory comes from. Not from selling more cars. Not from hiring more staff. From activating a sourcing channel that was available the entire time.
As noted in Front-End Gross Is Compressed, new vehicle front-end isn’t going to recover that gap. The used vehicle acquisition channel is where the P&L leverage lives right now — and this framework shows exactly why.
The Decision This Framework Is Built For
This isn’t a post about switching everything to database outreach overnight. Auction still has a role. Appraisal lane walk-ins still have a role. The framework is about making the allocation decision deliberately — with actual numbers behind it — rather than defaulting to auction dependency because it’s familiar.
The dealer principal who runs this analysis on their own operation and sees that 70% of their used acquisitions are coming from the highest-cost, lowest-gross channel has a clear decision in front of them. The question is whether they have the system to shift the mix.
The dealers generating 20, 30, 50+ database trade-ins a month — like Koons Motors, who produces 53 trade-ins monthly and $190,000 in gross from their existing customer base — aren’t doing it manually. They’re running an autonomous outreach system that makes database acquisition as consistent and scalable as auction sourcing, without the cost and margin compression that comes with auction dependency.
See what your database could produce →
FAQ
How do I calculate ROI on used vehicle acquisition channels? The core inputs are cost per unit acquired (all fees, transport, recon, and floor plan carry above trade allowance or buy price), average front-end gross per unit by channel, and secondary sale rate (replacement vehicle purchase). Divide net gross by total acquisition cost to get ROI per channel. The framework in this post provides conservative industry averages as a starting benchmark.
What is the average front-end gross on a database-sourced trade-in versus an auction unit? Database-sourced trade-ins from proactive outreach to past buyers average approximately $5,000 in front-end gross. Auction units, after accounting for all-in acquisition costs including fees, transport, recon, and floor plan carry, typically produce $1,200–$1,500 in net front-end gross. The spread of approximately $3,500 per unit is covered in detail in Auction vs. Trade-In: The $3,500 Gross Difference.
How much of my used inventory should come from my own database? There’s no universal answer — it depends on database size, market, and franchise. But the ROI framework above suggests that any dealer currently sourcing more than 50% from auction is leaving significant gross on the table if they have an active customer database and no systematic outreach program. A reasonable target for a dealer with a healthy database is 40–50% of monthly used acquisitions from proactive database outreach.
Does shifting away from auction sourcing create inventory gaps? In the short term, reducing auction volume without a reliable replacement channel creates risk. The sequencing matters: build the database outreach channel first, establish consistent monthly volume, then reduce auction dependency proportionally. Dealers who try to cut auction before the database channel is producing see inventory shortfalls.
What is the cost of running a database outreach program versus auction sourcing? Auction sourcing costs $1,800–$2,500 per unit above the buy price in fees, transport, recon, and carry. A database outreach program has a fixed monthly cost that doesn’t scale with unit volume — meaning the per-unit cost decreases as outreach volume increases. At 15+ units per month from database outreach, the per-unit economics favor database sourcing significantly over auction.
Related reading:
- Auction vs. Trade-In: The $3,500 Gross Difference Dealers Are Leaving on the Table
- What Does a Used Car Actually Cost You? The Real Math Behind Auction Dependency
- Front-End Gross Is Compressed. Here’s Where Dealers Are Finding Margin Instead.
- The Trade-In Gross Advantage: Why Your Own Customers Are Your Highest-Margin Inventory Source
- Where Dealer Gross Comes From in 2026: A Franchise Dealer’s Guide to Used Vehicle Margin